VELA

VELA is a mobile web application that provides surfers and other water sports enthusiasts with quick and easy access to wave, weather, and wind reports, so that they can make the most of their days on the water.
My Role
UX/UI Design | UX Research
The Client
CareerFoundry | Speculative
Timeline
July 2023 - December 2023
Tools
The Problem
Surfers of all skill levels need an easy way to find understandable and reliable surf reports and forecasts for surf spots around the world, because they need to make safe and informed decisions before heading out for their day on the water.
A Potential Solution
Design and develop a mobile web application that leverages innovative UX design principles to provide surfers with intuitive, accurate, and personalized wind, wave, and weather information through surf reports.

The Design Thinking Process
User Surveys & Interviews
Short user surveys were shared on social media and community platforms. A small selection of these surveyed participants were asked to participate in user interviews. These short 20 minute interviews were conducted via Zoom over the course of a few days. This research allowed us to uncover valuable insights into potential VELA users’ behaviors, preferences, and pain points, helping to inform the development and enhancement of the VELA app without investing a great deal of time.
Discover
Research Goals
Gain a comprehensive understanding of water sports enthusiasts needs, preferences, and behaviors when it comes to accessing wind, wave, and weather information
Identify the specific pain points and challenges users currently face in obtaining accurate wind, wave, and weather information for water sports activities
Evaluate and assess user’s experiences with existing mobile apps and websites for checking weather conditions in relation to water sports
Determine the critical information users prioritize when planning for or engaging in water sport activities (ex. wind speed, wave height, forecasts, specific locations.)

Vela User Research Affinity Mapping using FigJam

User interviews were conducted via Zoom.
Insights
Users prioritize accurate and up-to-date information on wind speed and wave height as essential factors when planning water sport activities
Existing apps often pose challenges, as they are perceived as complex and lacking user-friendly interfaces, leading to frustration
Users appreciate the idea of customizable dashboards expressing interest in tailoring tools to display information specific to their sport of choice and location
Users have an strong interest in community features where they can share experiences, tips, and favorite locations with fellow water sports enthusiasts
User Personas
Define
User Personas were developed using the information gathered from user interviews. Keeping these personas and their challenges in mind, allowed empathy for potential users and revisiting them often throughout the process aided in maintaining user-centric focus.

Maya
Maya is a creative and adventurous digital nomad who has been traveling and working remotely for the past three years. She combines her love for design with her passion for surfing, seeking out coastal destinations with good waves for both work and play. She values flexibility and freedom in her lifestyle.
Bio
Age:
28
Education:
Bachelors
Status:
Single
Graphic Designer
Occupation:
Location:
Bali, Indonesia
Goals & Needs
Work-life integration
Discover surf-friendly destinations
Connect with local surf communities
Frustrations
Unpredictable work schedule
Limited local knowledge
Safety concerns
Motivations
Balancing work and surfing in picturesque locations
Exploring new surf spots and cultural experiences
Building a global network of like-minded surfers and digital nomads

Jake
Jake is a recently divorced dad who shares custody of his two young kids with his ex-wife. He’s passionate about surfing and sees it as a way to connect with nature and find moments of peace amidst the challenges of single parenthood. He’s been surfing for several years and considers it a key part of his identity.
Bio
Age:
34
Education:
Bachelors
Status:
Divorced
Occupation:
Marketing
Location:
San Diego, CA
Goals & Needs
Balance work and parenting
Discover new surf spots
Connect with other surfers
Limited time
Weather uncertainty
Community engagement
Frustrations
Motivations
Finding moments of relaxation & joy through surfing
Connecting with a community of like-minded individuals
Improving surfing skills & discovering new challenges
User Flows
User flows and task analyses were created for each user persona. These gave a clearer picture of the steps users would need to take to achieve their goals and how to deliver these in the most effective way. Here are two user flows that represent common scenarios of potential VELA users.
User Flow 1
Checking Local Surf Conditions
User opens the VELA app on their mobile device
User arrives at “Home” screen
User selects their preferred location from listings. User can opt to change these listings by selecting “Edit”
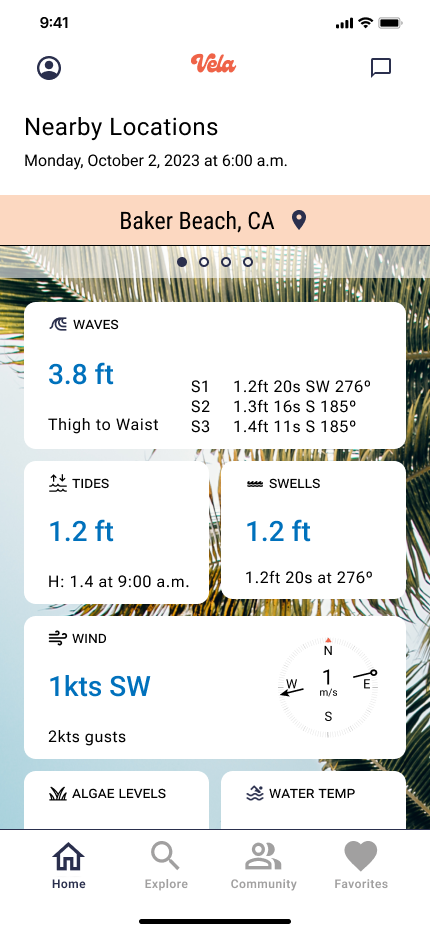
VELA displays real-time surf location conditions, including wave height, swell direction, wind speed, tide information, and water temperature for the selected location
User has the option to explore additional details, such as “Surf Forecast,” “Location Overview,” and “Live Stream”

User Flow 1
User Flow 2
Exploring Global Surf Spots
User selects the “Explore” section of the app from the bottom navigation menu of the “Home” screen
User inputs desired location into the search bar of the “Explore” page. VELA provides a list of locations in relation to the input location. User can filter spots based on criteria like difficulty or user ratings. User can opt to search using map view.
User selects location to review location conditions details
The app displays real-time surf conditions for the selected surf spot. The user can opt to review “Location Overview,” “Surf Forecast,” or “Live Stream”

User Flow 2
Sitemap

A card sort was conducted using Optimal Workshop, to gain insight on how potential users might expect the application’s content to be displayed. The results of this card sort were used to create a sitemap for VELA.
VELA Sitemap created using FigJam
Ideate
Low-Fidelity Wireframes
A quick exploration of possible designs was done in simple low-fidelity wireframes This early exploration of ideas, allowed testing for different layout structures, information hierarchies and user flows without investing significant time or resources.

Initial outlines for VELA screens
Mid-Fidelity Wireframes
The mid-fidelity wireframes featured below, were drafted to refine the layout and of VELA. Incorporating basic visual elements, allowed the creation of a interactive prototype that could be tested on potential users.

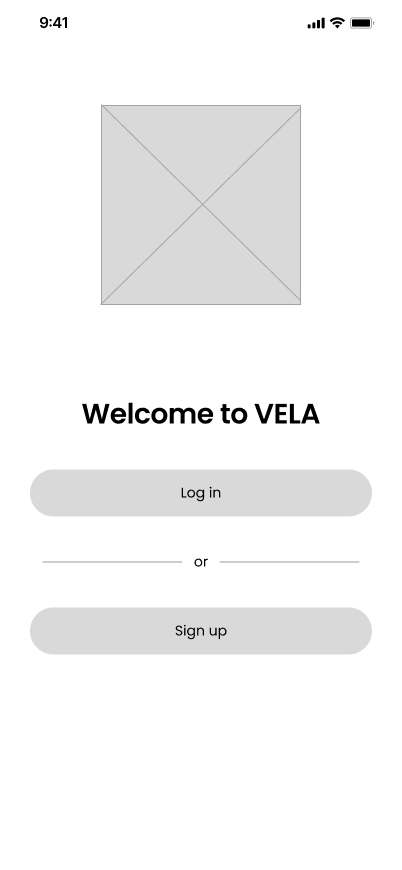
Log in or Sign up


Log in


Sign up

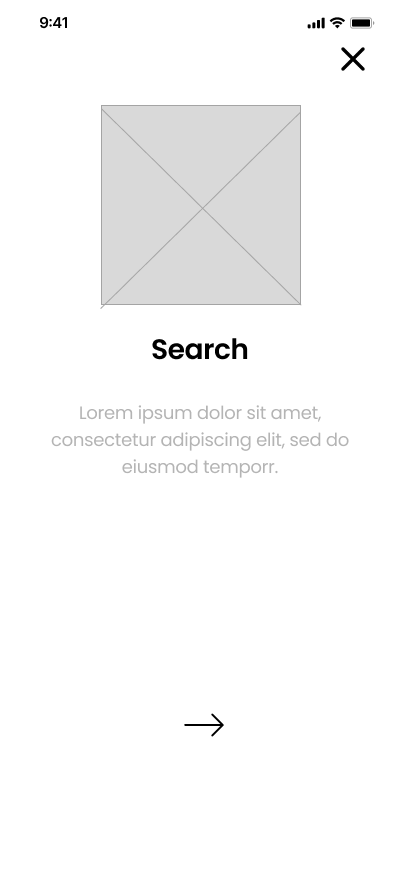
Onboarding 1


Onboarding 3


Onboarding 4

Splash Screen


Home


Home (List View)


Explore


Explore (Map)


Explore (Filters)


Alerts


Location Overview


Location Conditions


How to Read Reports


Favorites
Test
Usability Testing
User testing on the mid-fidelity prototype yielded a variety of insights. Analyzing these insights, allowed for informed decisions to enhance the apps usability, functionality, and overall user experience. This information would later be used when creating high-fidelity wireframes.
Goals
Evaluate usability and how easily users can perform key tasks
Understand the learning curve and identify pain points of first time users
Test key features and their functionality such as checking wind speed, wave height, and weather forecasts
Gather feedback on user interface and identify areas that may need improvement

Affinity Mapping VELA usability testing results with FigJam
Insights
Users experienced issues understanding surf report charts
Users felt frustrated with excessive steps and scrolling
3/6 experienced confusion when reviewing weather alerts
3/6 users struggled to find help on how to read surf reports
Preference Testing
Preference testing was performed to bring the opinions of potential VELA users to the forefront. This qualitative insight allowed for moving forward with a prototype that was based on more user-centered design choices.
VELA Preference Testing Results using Lynssa
Option 1
Option 2


Prototype
High-Fidelity Wireframes
The high-fidelity wireframes, featured below, brought VELA to life, creating a realistic preview of what would be the final product. Adding UI elements, such as color scheme, typography, and images gave a more accurate representation of the product going forward.
Design Language System
The design language system for VELA, was created based upon the results and feedback from preference testing.
Following these style guidelines, would ensure consistency, efficiency, and brand identify throughout the design and development of VELA.
A more extensive guide was developed to create a Design Language System for VELA.

See the complete VELA Design Language System .
Accessibility
To ensure creation of a more inclusive, ethical, and user-friendly product, that addressed the needs of individuals with disabilities, such as visual impairments and improved overall user experience the following iterations based upon Web Content Accessibility Guidelines were made:
Line spacing was improved, so that it was at lease 2x the font size
Spacing following paragraphs was improved, so that it was at least 2x the font size
Text size was increased, so that the minimum text size was no smaller than 14px
Button sizes were changed to be at least 44x44 CSS pixels
Error text fields with both color and error signs were added to help users better understand when an error occurred

Example of design iterations to better serve visually impaired users of VELA - Addition of error signals

Log in or Sign up

Sign up


Log in
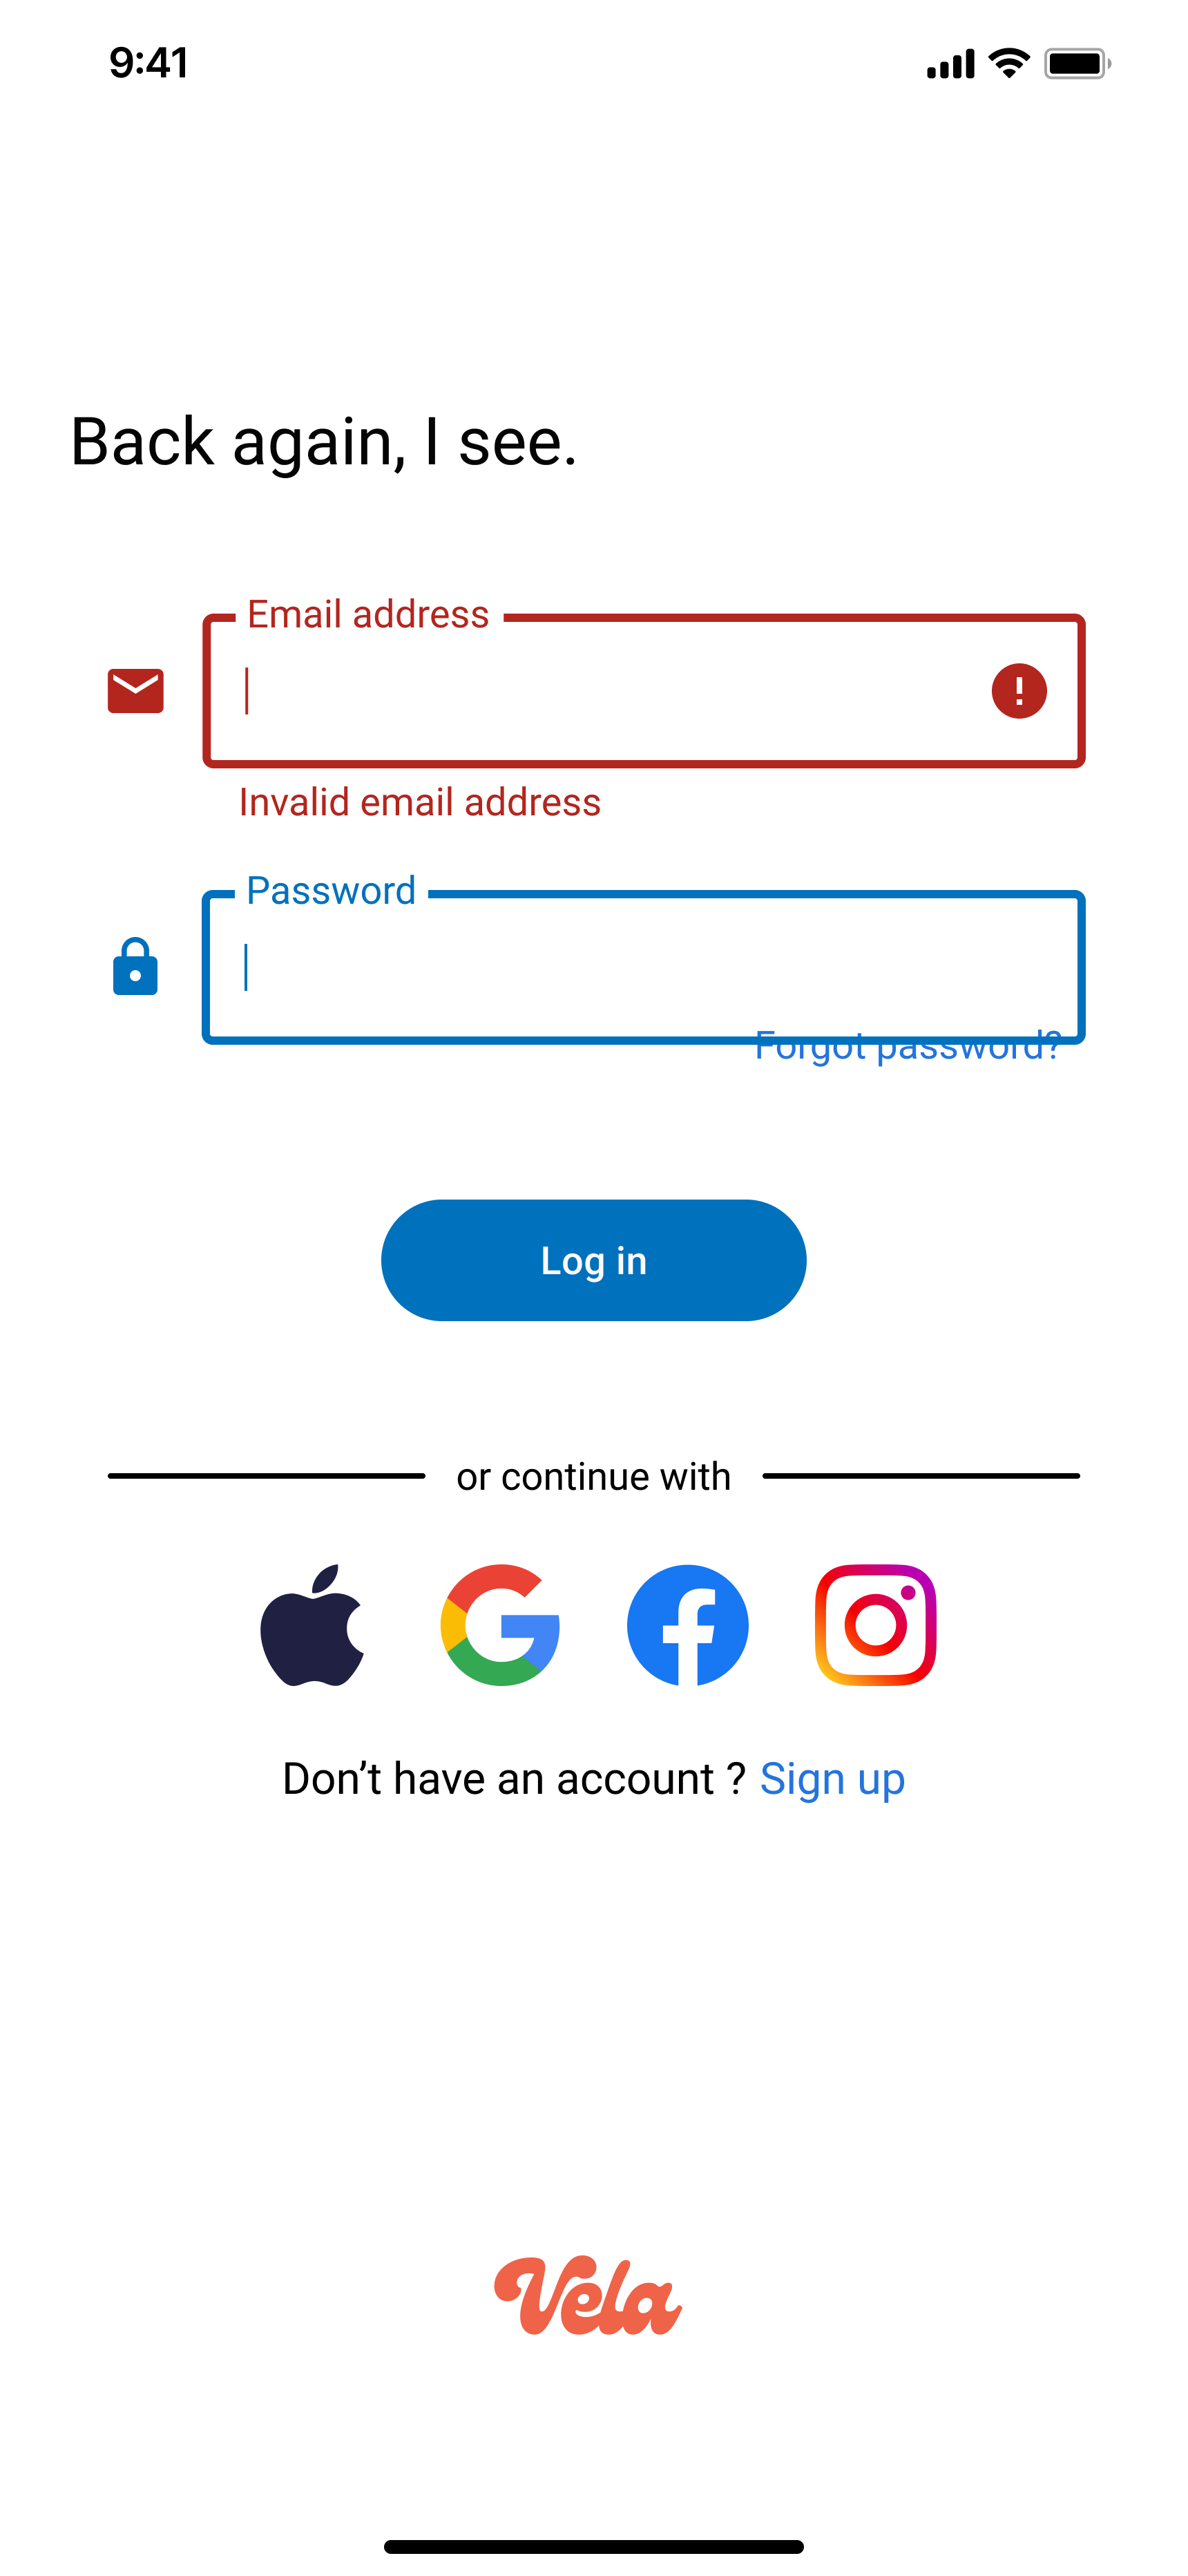
Log in (with input error)

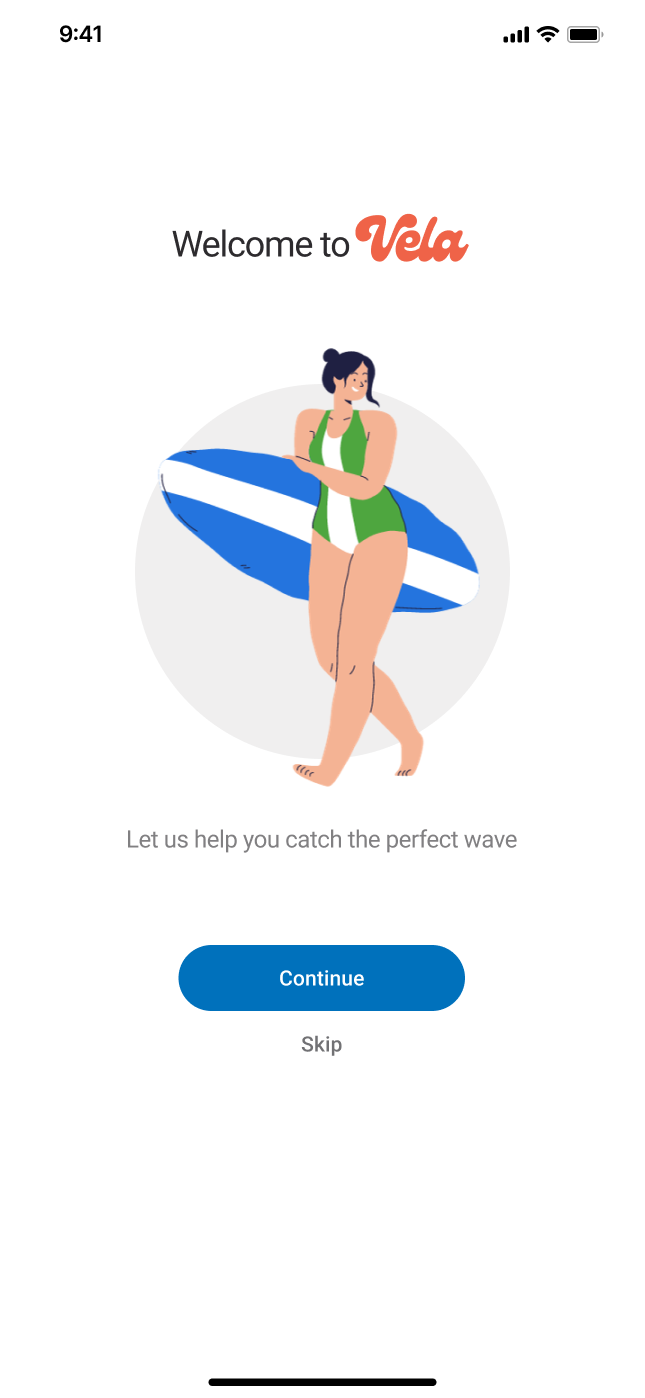
Onboarding 1


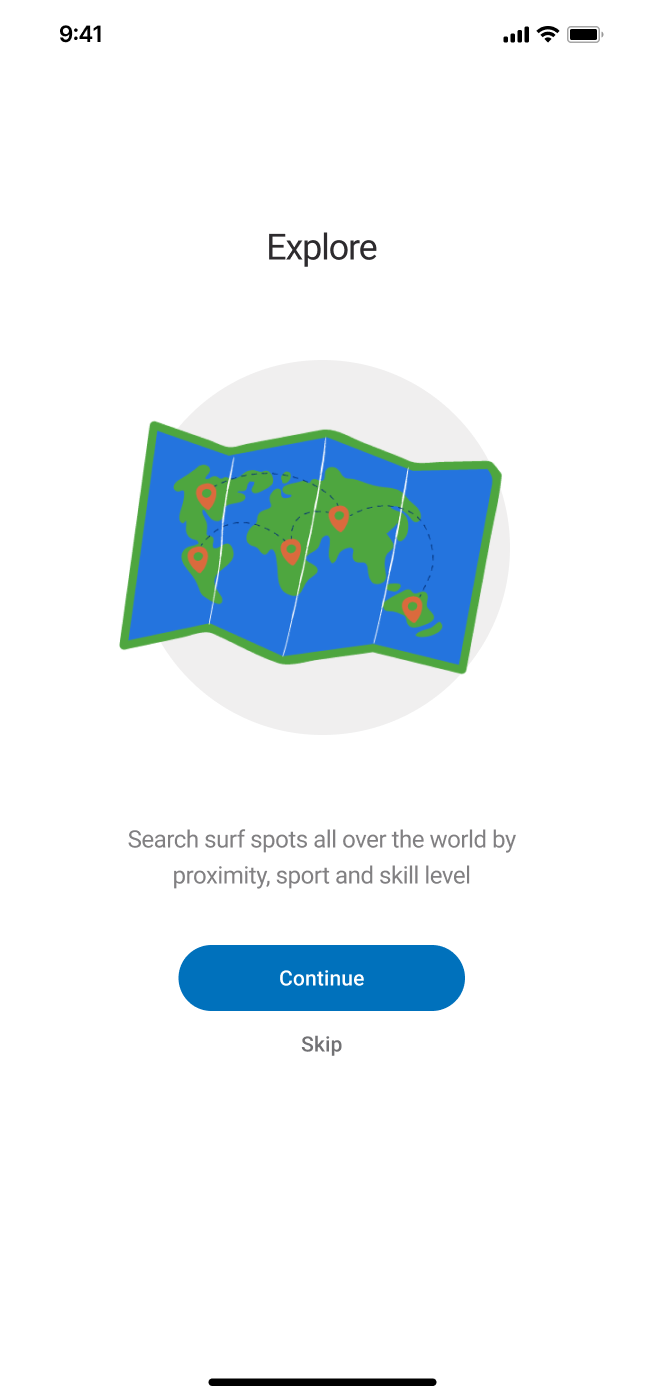
Onboarding 2

Onboarding 3
Onboarding 4

Splash Screen
Home

Explore

Explore (Map View)
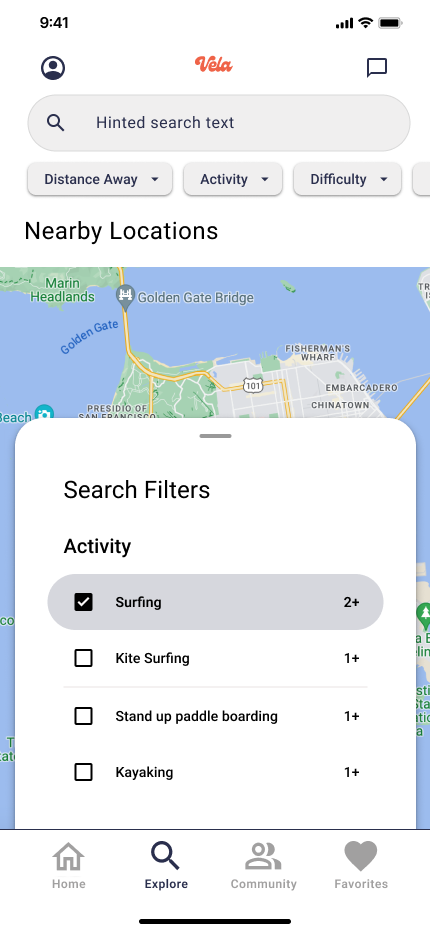
Explore (Map View + Filters)


Location Overview
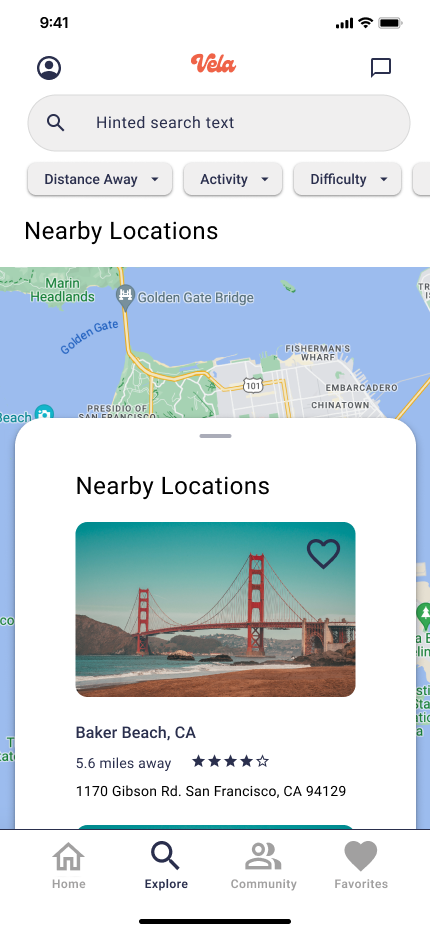
Nearby Locations
Interested in trying it out?
Thank you for reviewing the VELA case study.
Your feedback is greatly appreciated. If you would like to share or are interested in collaborating, please feel free to reach out.